Runs and history
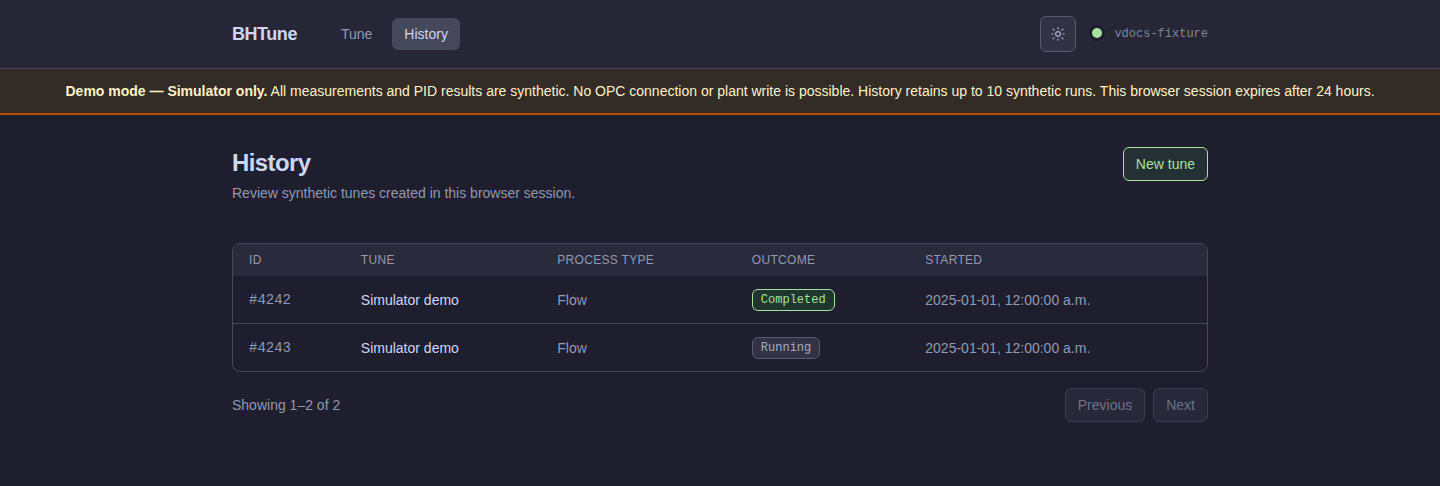
The History page at /runs lists stored tunes with filters and pagination. A run detail page
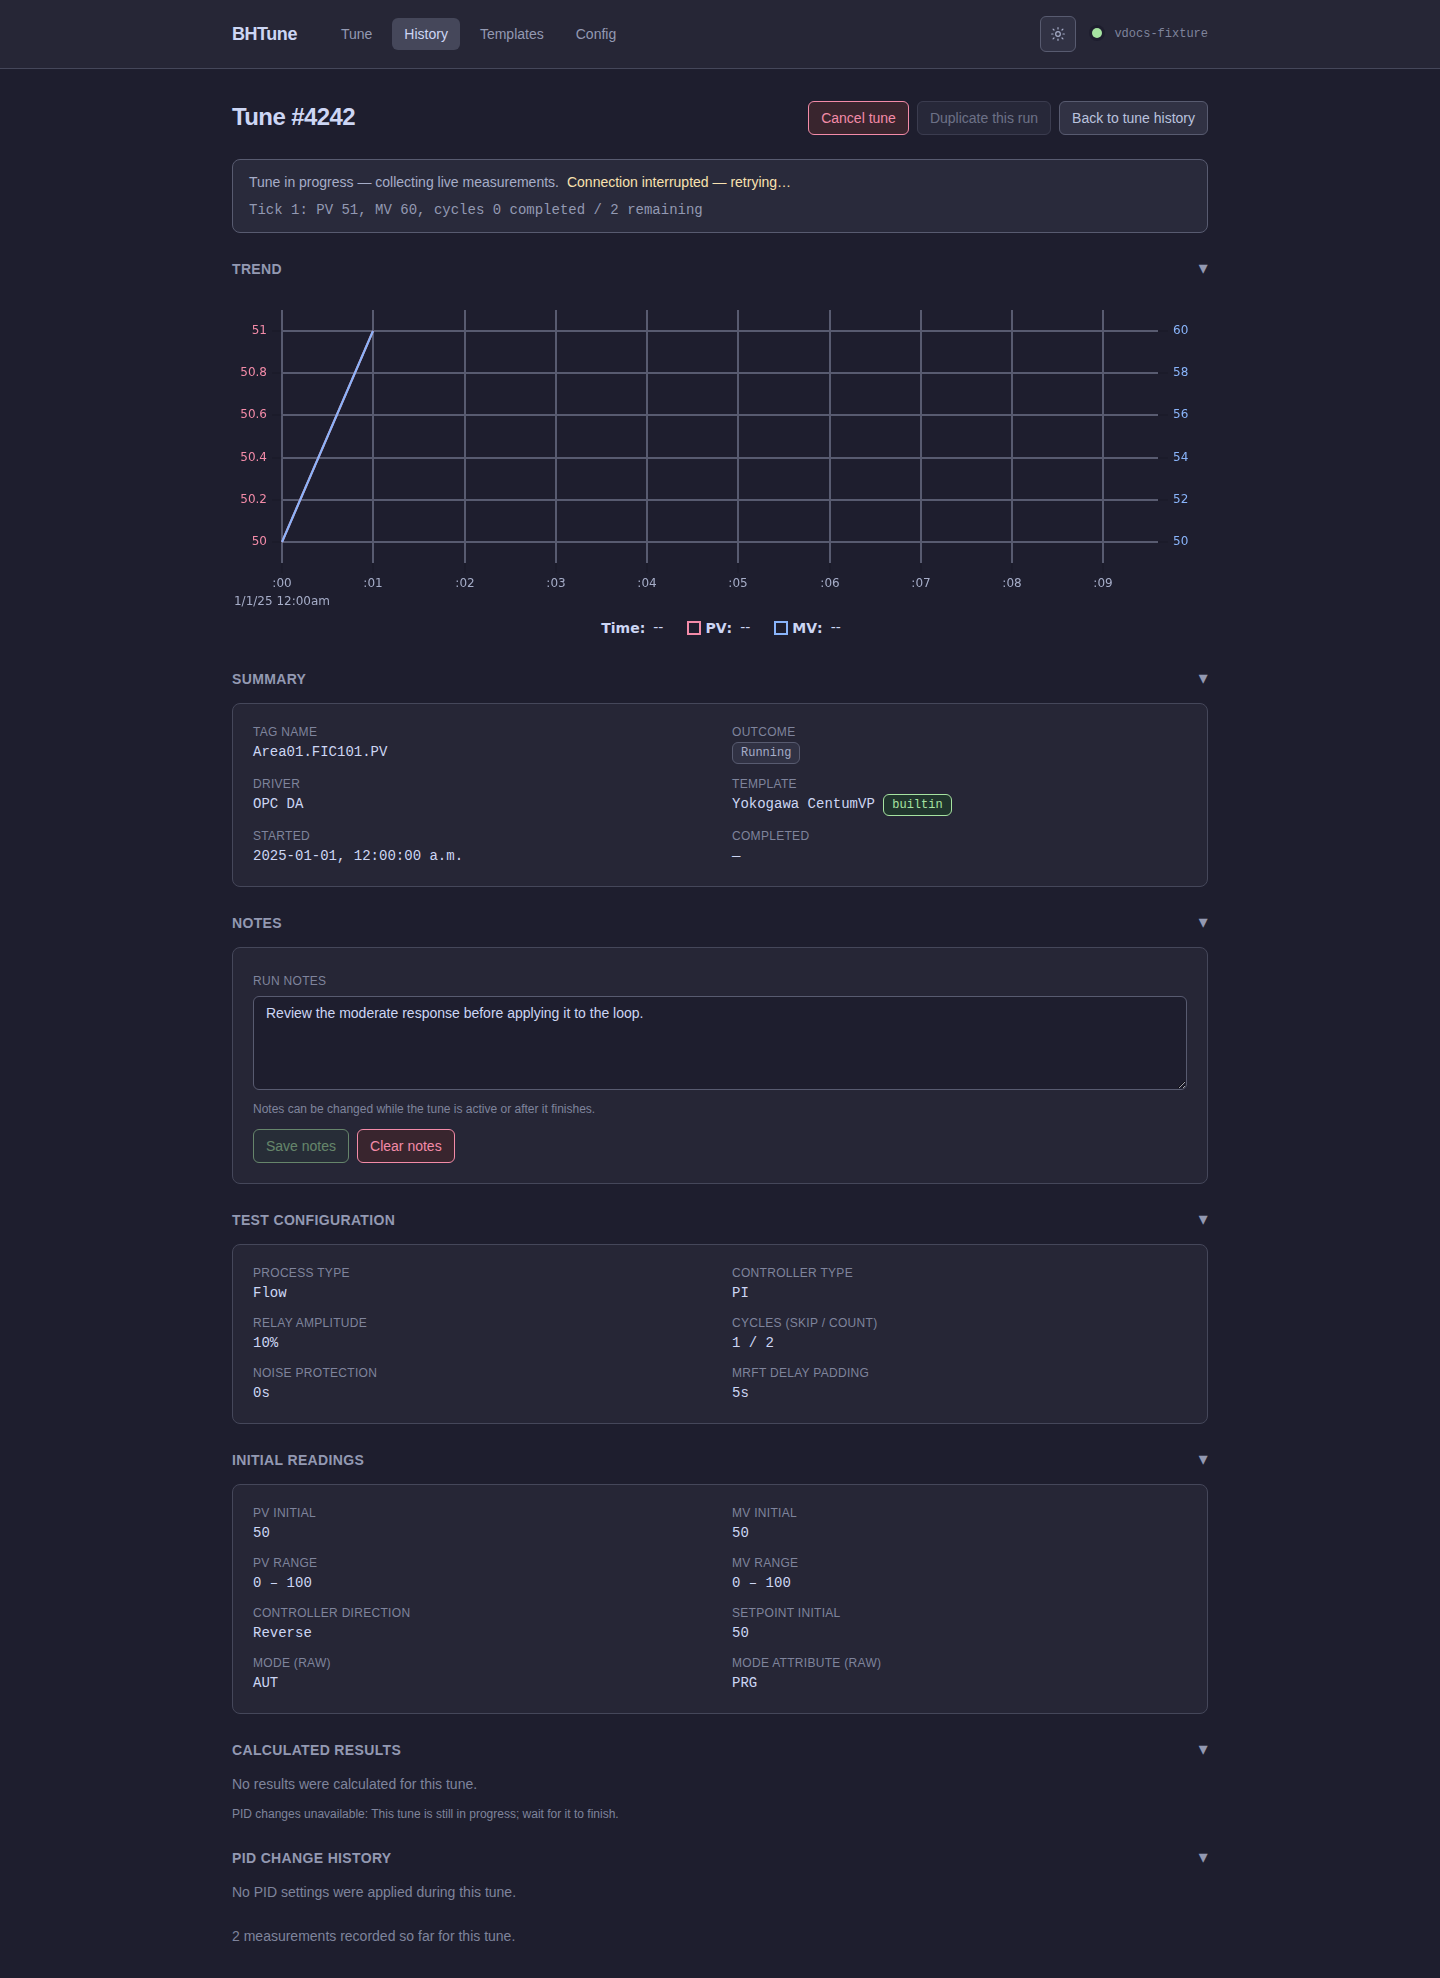
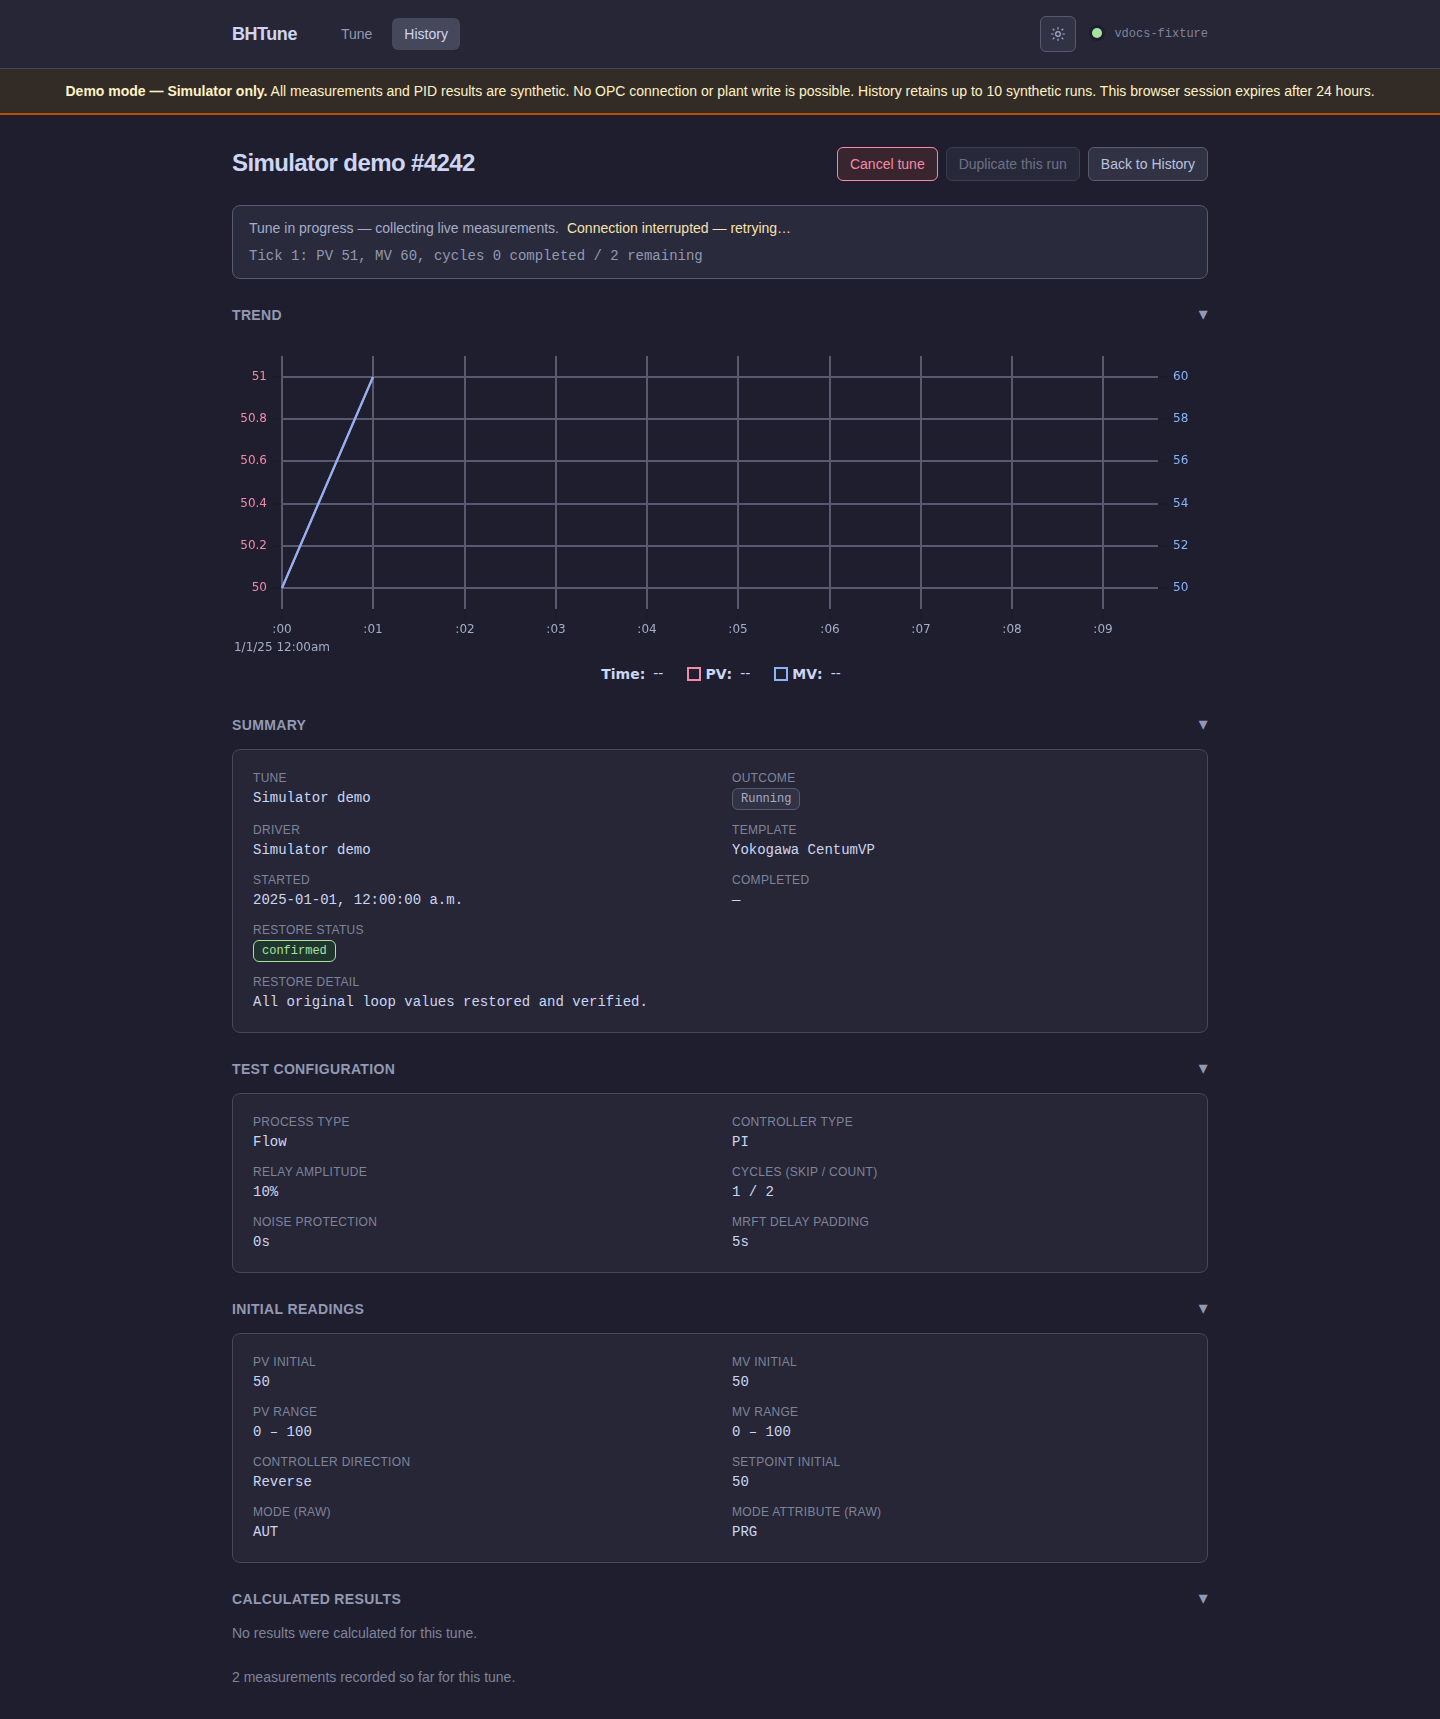
at /runs/:id shows the live or completed trend, configuration, results, notes, initial
readings, and PID audit information.
History list
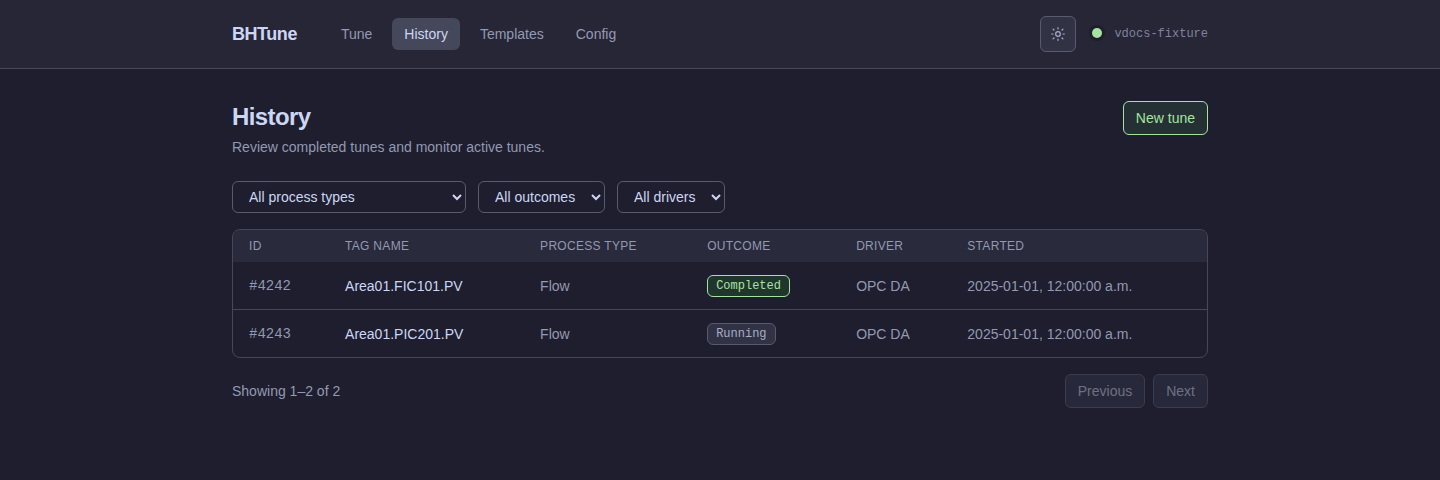
Demo history is private to the anonymous browser session that created it. A different browser
profile receives the same 404 for another session's run ID.
Live run detail
While a run is active, the trend chart streams persisted samples over Server-Sent Events. The initial PV/MV readings appear before the first MRFT sample, and a Cancel run action follows the same abort-and-restore path as the CLI. Simulator timestamps use the configured fixed poll step; live OPC DA timestamps use monotonic elapsed time projected onto the run start.
Completed run detail
Once a run completes, the page hands the chart to the stored samples and shows the calculated results before the trend. The trend adds presentation-only initial-reading and restored-MV boundary points; exports contain the persisted sample series. Invalid results remain visible with a reason and cannot be written as PID constants.
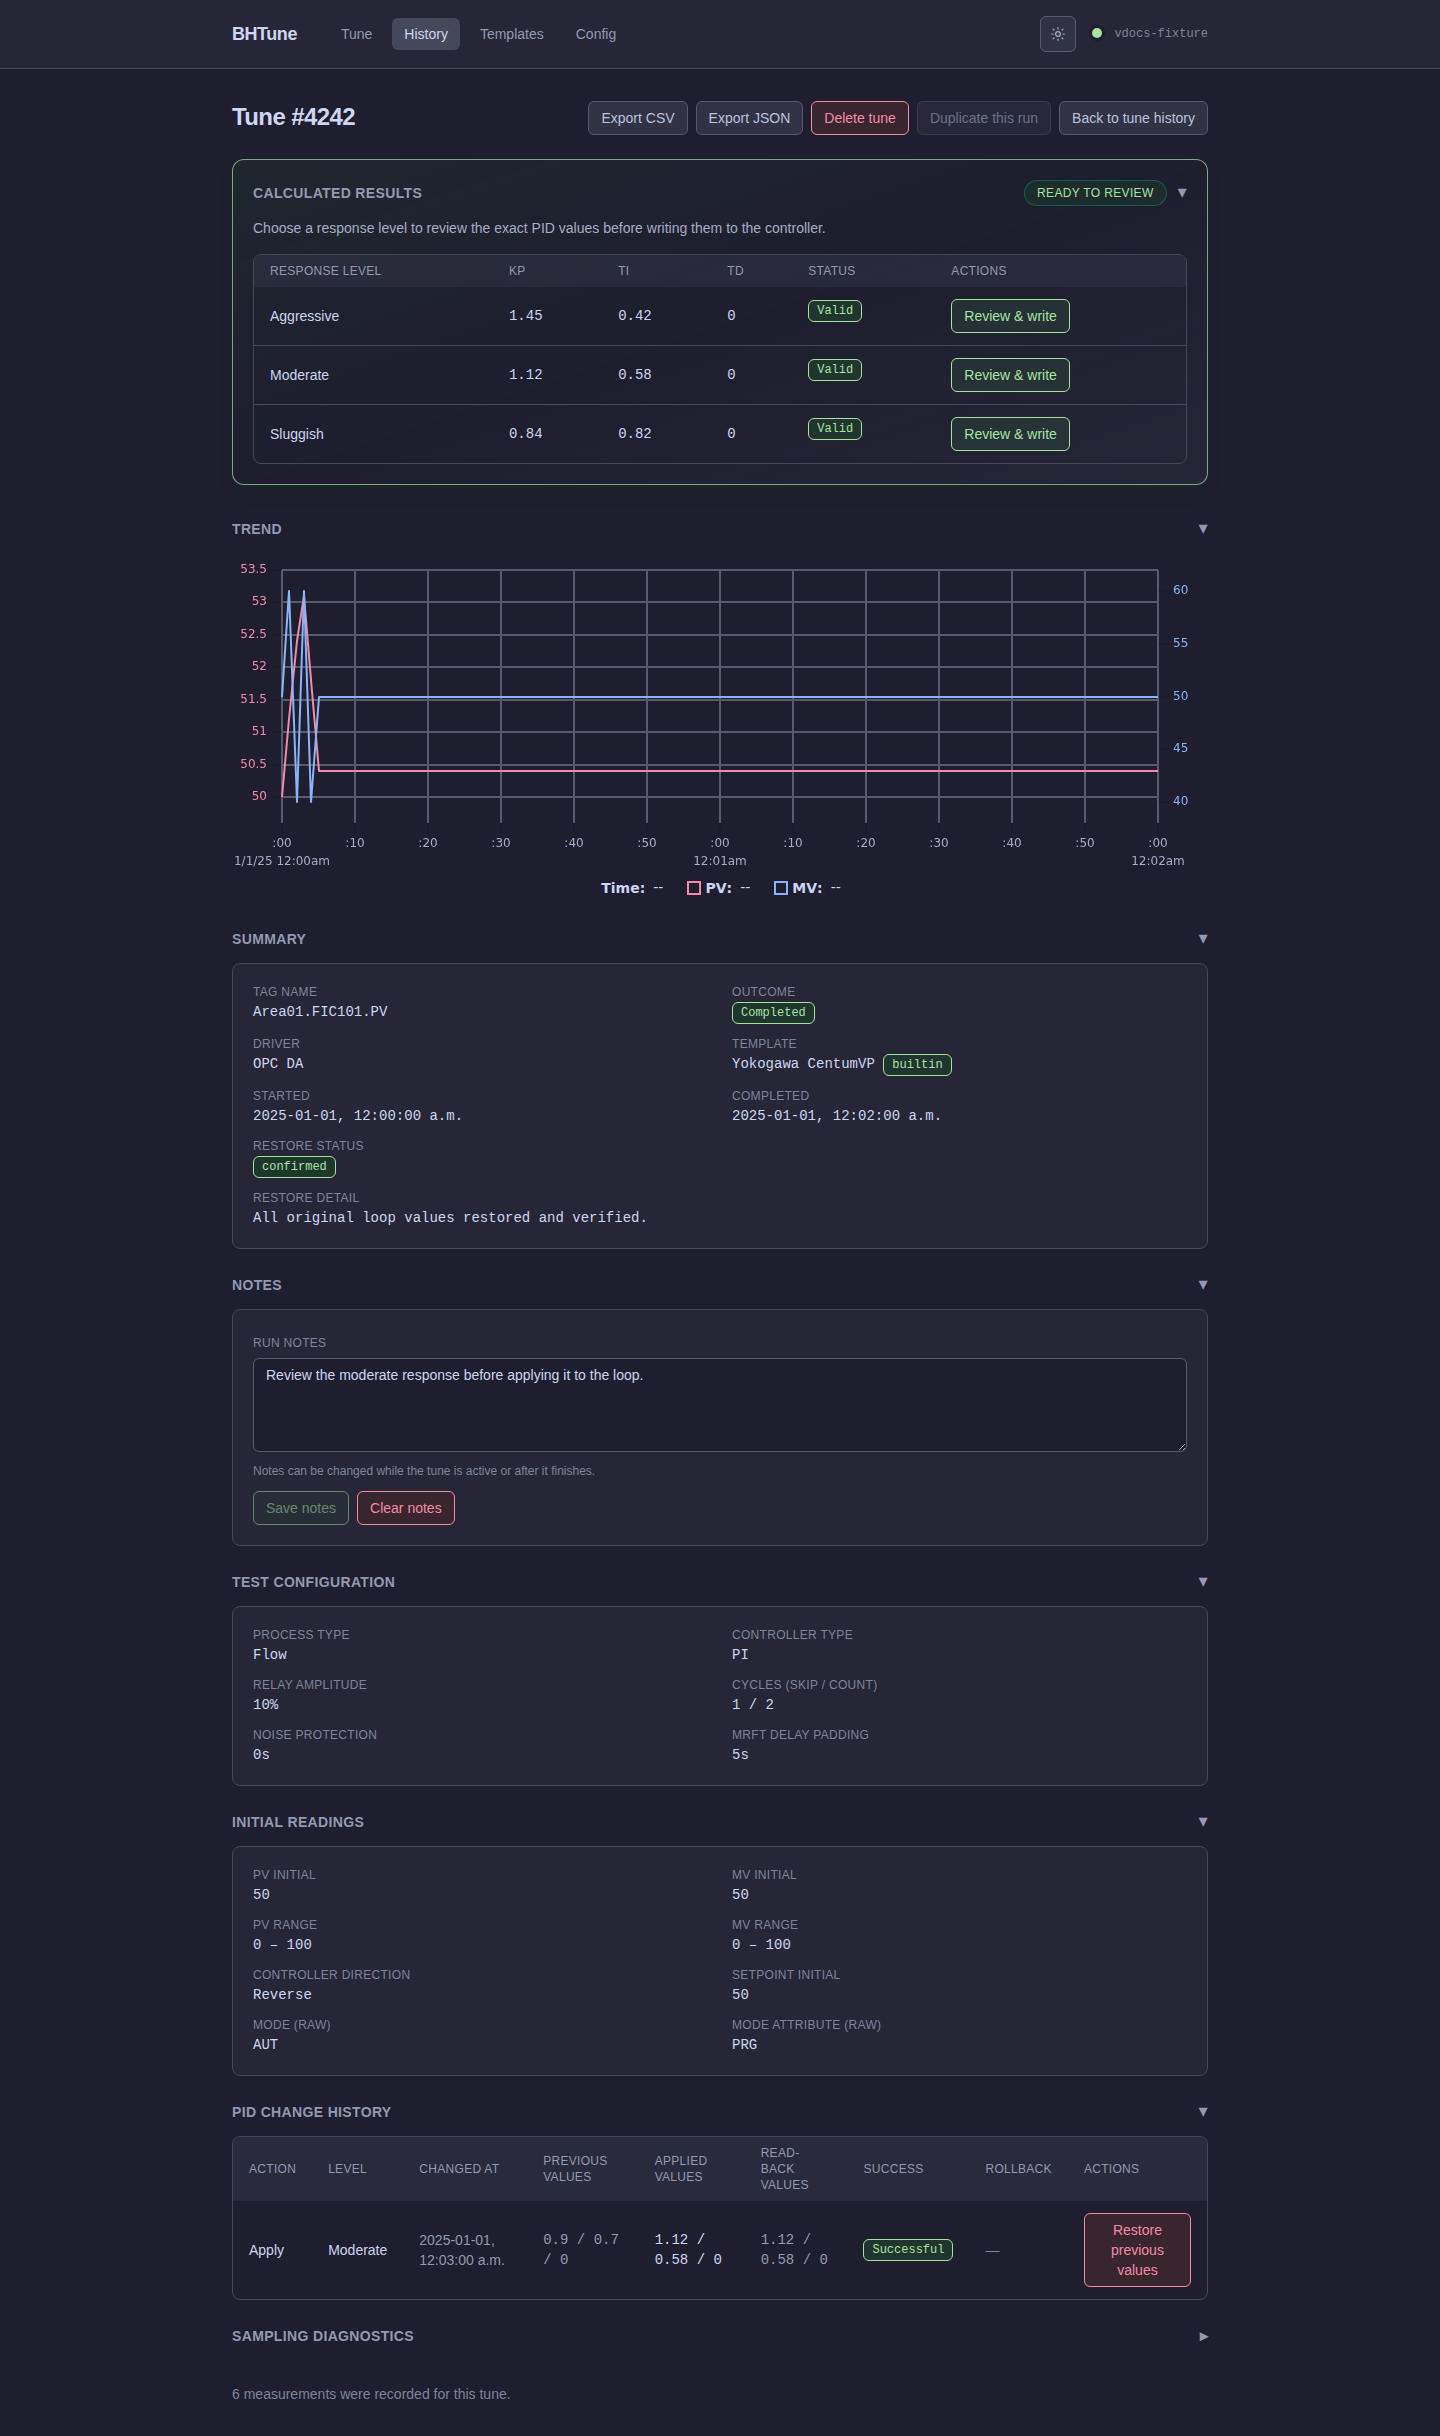
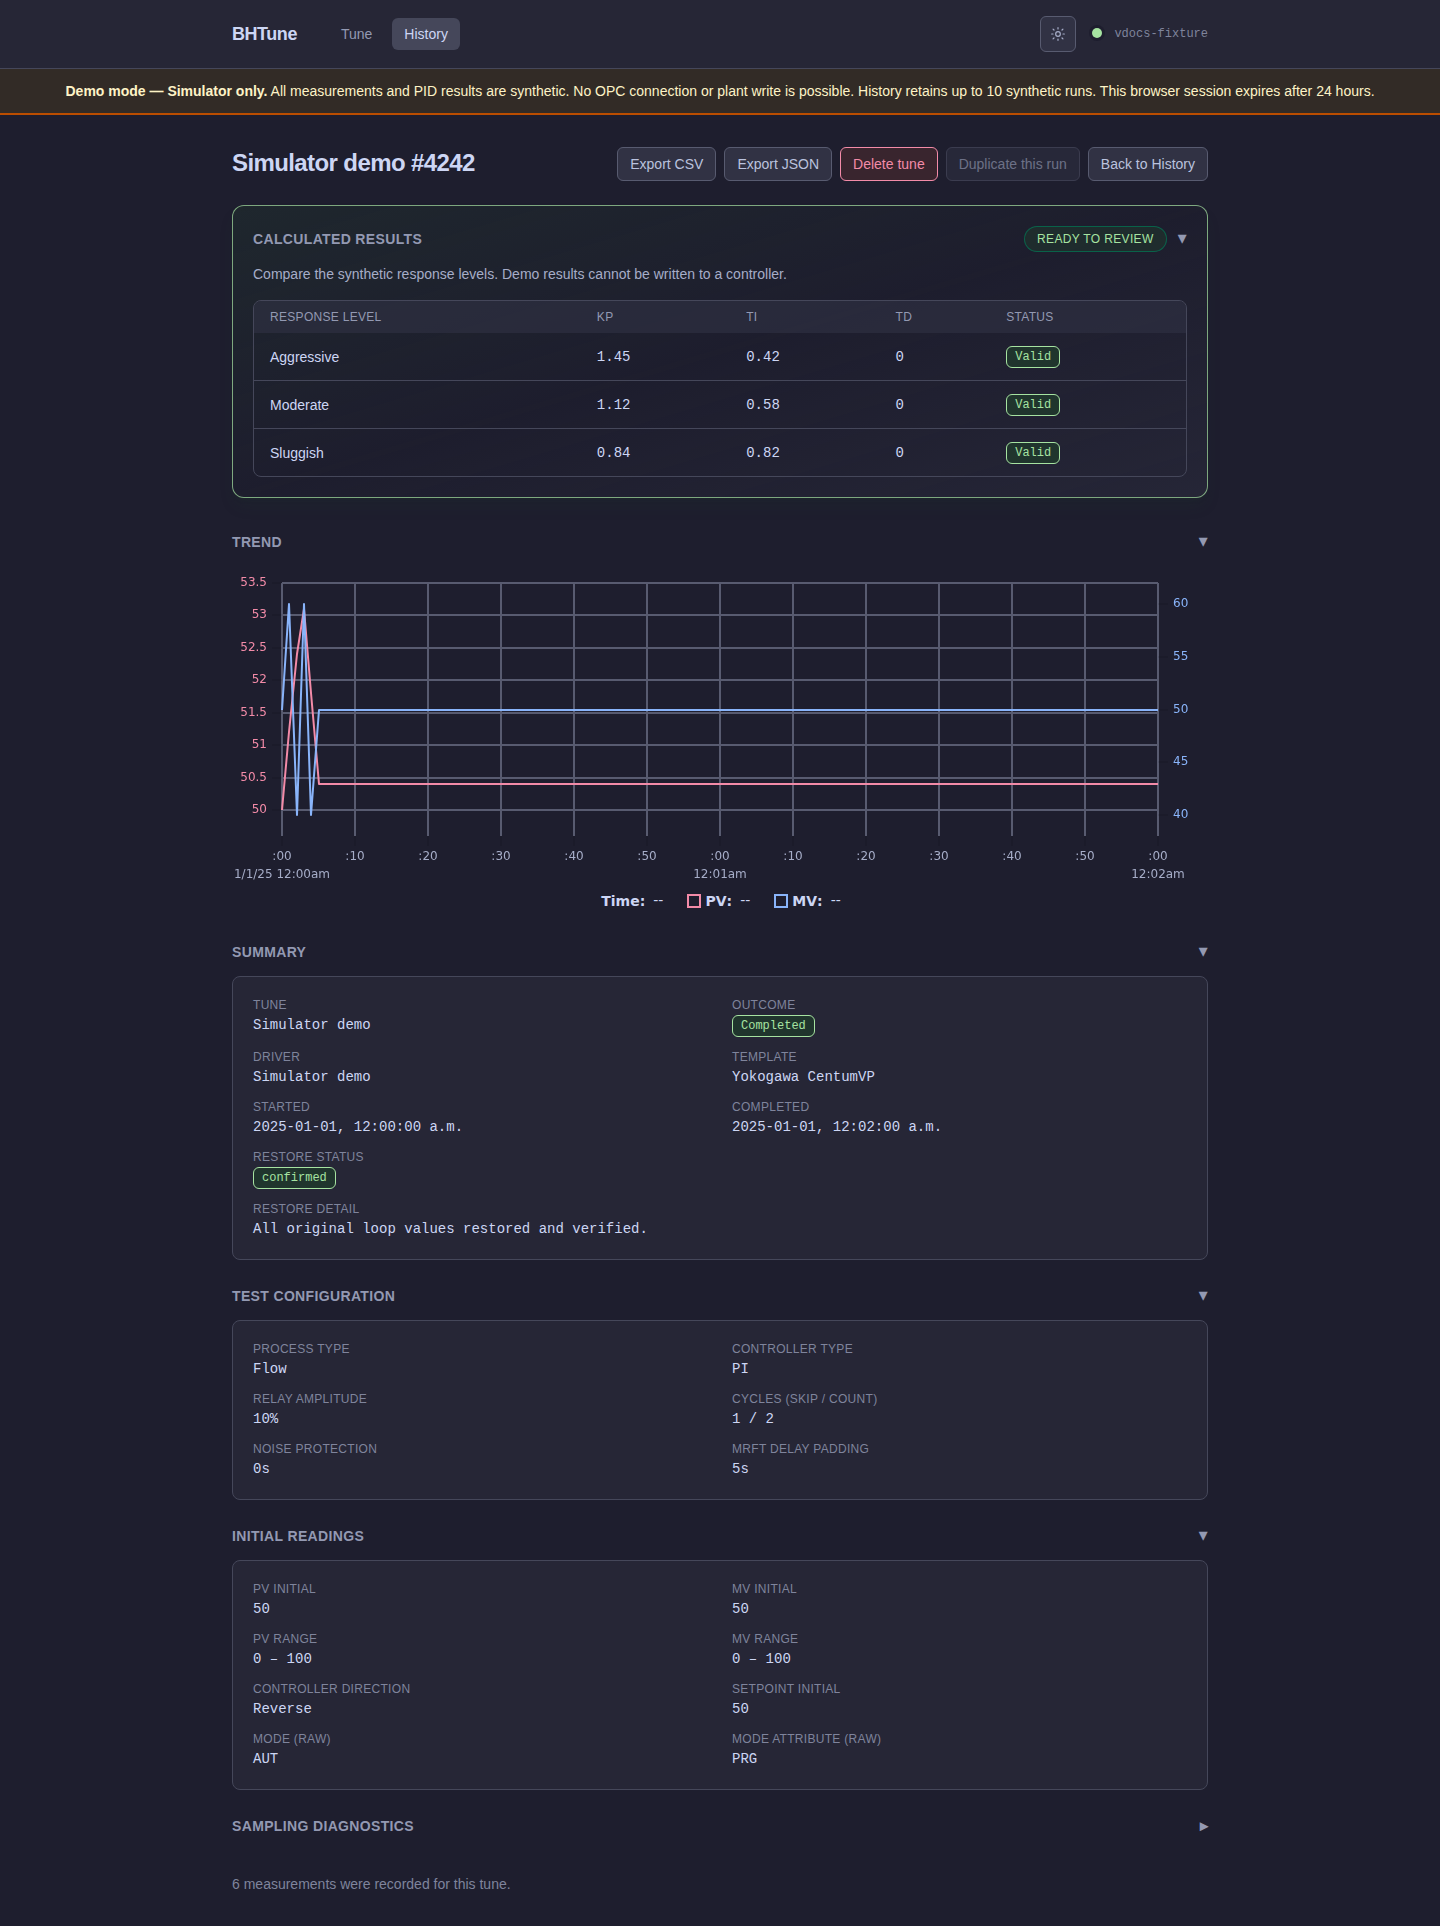
The page's independently collapsible sections include Summary, Notes, Test configuration, Initial readings, PID change history, and Sampling diagnostics. Sampling adequacy is advisory: adequate means at least six observed samples per measured period, marginal means fewer than six, and not assessed means no usable period exists.
Reviewing PID actions
Eligible completed OPC DA runs show Review & write for each calculated response level. The review popup names the loop tag, response level, snapshotted parameter labels, exact destination tags, and values. Apply closes the popup while the request continues in the background; physical write and readback failures appear in the page alert and audit table.
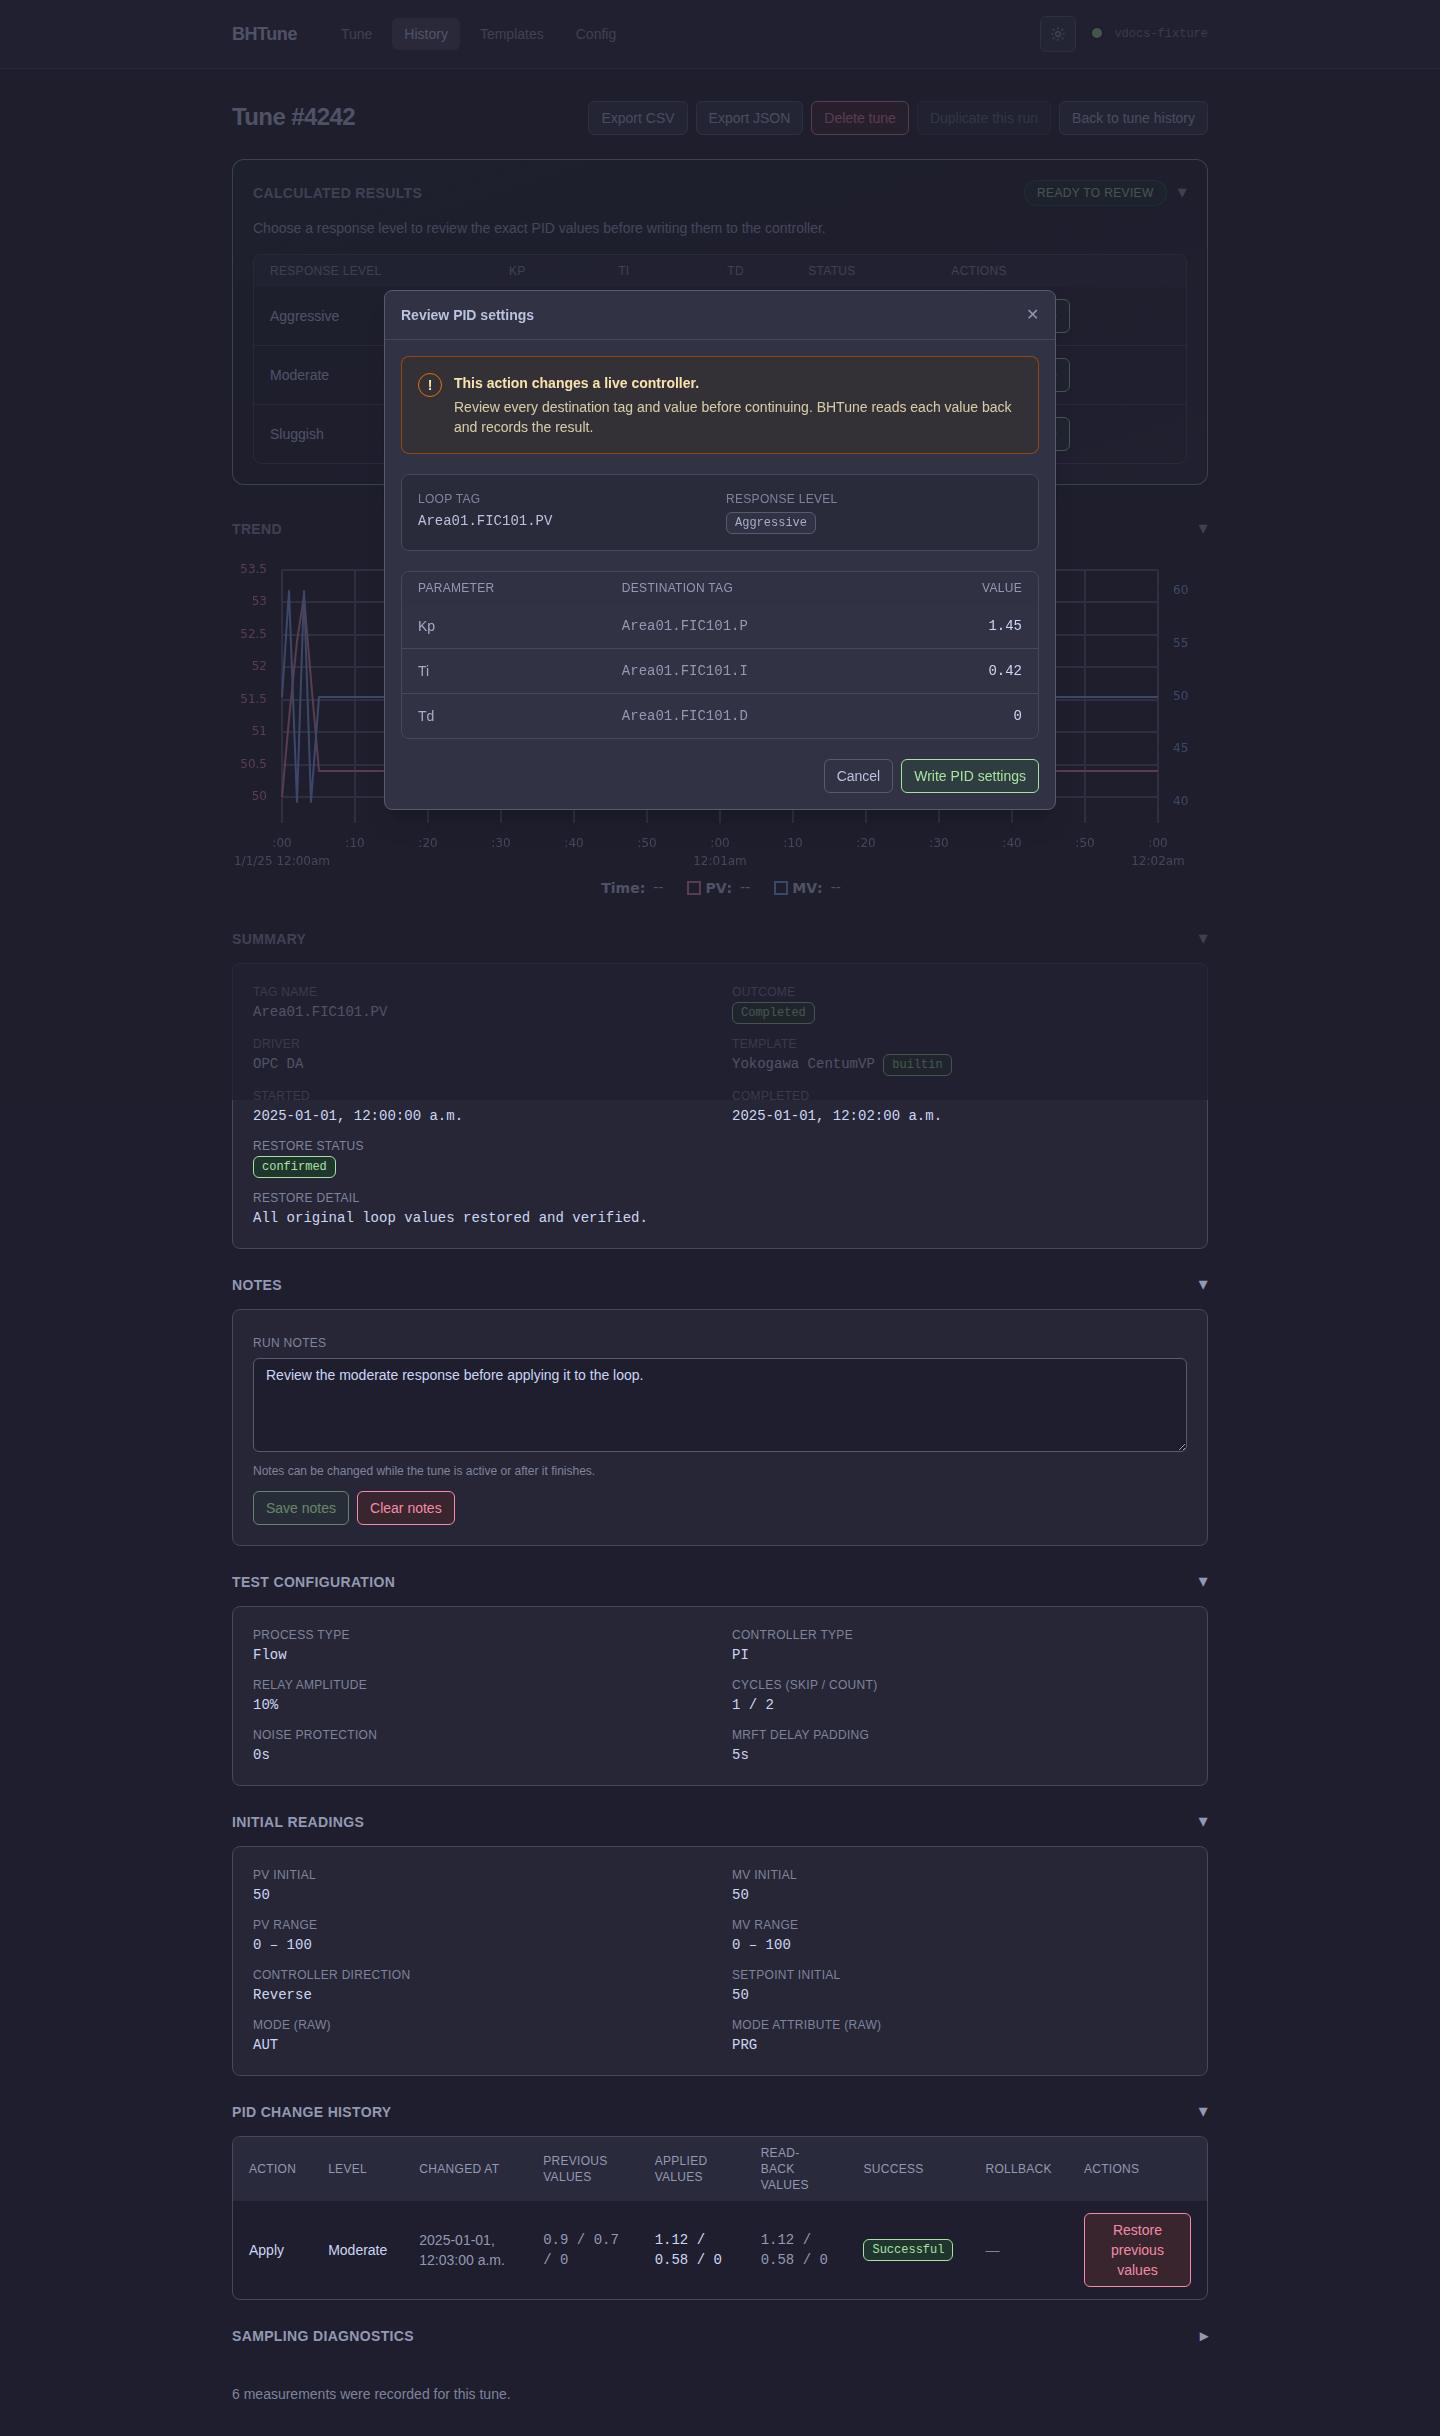
The newest successful write offers Restore previous values through the same popup. Both actions are disabled with a reason unless the run is finished, used OPC DA, has all PID tags, and recorded its original server and bridge connection. Export CSV/JSON, Delete tune, and Duplicate this run are available from the completed detail page.